March 31, 2017
Demystifying Deep Neural Networks
Deep learning is a big topic and it can be pretty difficult to know where to start. When I first began learning about it, I found myself wading through very technical explanations with unfamiliar terminology and it was hard to abstract this away and develop an intuitive understanding of what is actually going on.
When I finally felt like I got my head round it I decided to create the explanation I wish I’d had access to. It’s aimed at people with some technical background and a basic grasp of maths (i.e. GCSE level), but assumes no prior machine learning knowledge. There are a lot of simplifications, and a lot is missed out, but it’s my attempt to demystify neural nets and provide an ‘intuition’ that can serve as a foundation for further technical reading.
History
Despite their current buzz, neural networks are not a new concept. The idea of a biologically-inspired ‘perceptron’ was first explored in the 1940s, when the field was known as ‘cybernetics’. Unfortunately, some perceived limitations (such as the single-layer perceptron’s inability to model the XOR function) meant that it eventually fell out of favour.
In the 1980s, the field saw somewhat of a resurgence under the name ‘connectionism’. However, it was once again abandoned due to a lack of capable hardware and large datasets required for training to achieve good results.
‘Deep learning’ as it is currently known enjoyed yet another resurgence in the late 2000s. We now have more powerful computing hardware and GPUs optimised for training, as well as an abundance of freely available data on the internet. Could this mean that this time, neural networks are here to stay?!
Neural Nets vs Conventional Computing
Let’s try to understand how neural networks differ from conventional computing using a trivial example. If I wanted to write a conventional computer programme to recognise images of cats, I would essentially have to chain up a whole load of ‘if’ statements:
`IF (furry) AND`
`IF (has tail) AND`
`IF (has 4 legs) AND`
`IF (has pointy ears) AND`
Etc…
Here, we are explicitly programming the computer for what features to look for. However, it’s pretty easy to see that these features could also apply to a dog or a fox, and it would be tricky to account for unusual edge cases like a cat without a tail or only three legs.
In a neural network on the other hand, we simply show the computer a load of examples of cats:
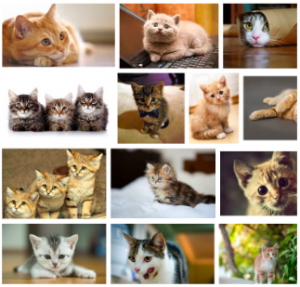
And a load of examples of not-cats:

Here, the computer works out what to look for, and what features are essential to ‘cat-ism’. This is actually a lot closer to the way humans learn to distinguish objects, and is why we call them ‘neural’ networks — they are inspired by biology and how our own brains work.
Here’s another way to think of it (this is actually a diagram illustrating a function created by a Support Vector Machine but I think the idea is still helpful in the context of neural networks):
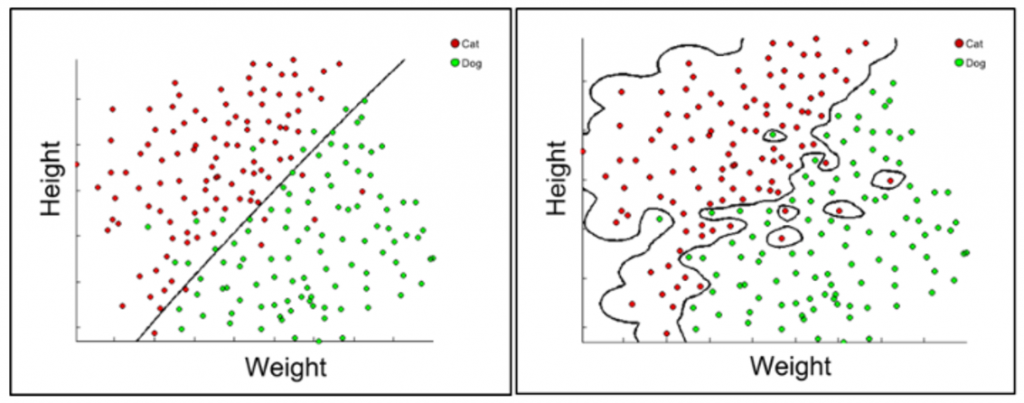 Image source: kevinbinz.com
On the left, a straight line attempts to separate the red dots (representing cats) from the green dots (representing dogs). While it does a relatively good job, there are still dots on the wrong side of the line. This would be a very easy function to model using conventional computing, using a straight line equation of the form:
y = mx + c
On the right, a much more complex function manages to successfully partition the dots, including weird outliers. It would be incredibly hard to write a function to describe this ‘line’ using conventional computing, but this is exactly the kind of complex function a neural network is able to learn, and it is clearly able to account for edge cases much better than explicit programming can. Here, we’ve only used two features (height and weight), whereas a neural network can handle many more features to learn a complex, robust, multidimensional model.
The best rule of thumb I have is: > Neural nets are good at things humans are good at (e.g. pattern matching), and bad at things computers are good at (e.g. maths and logic)
Inside a Neuron
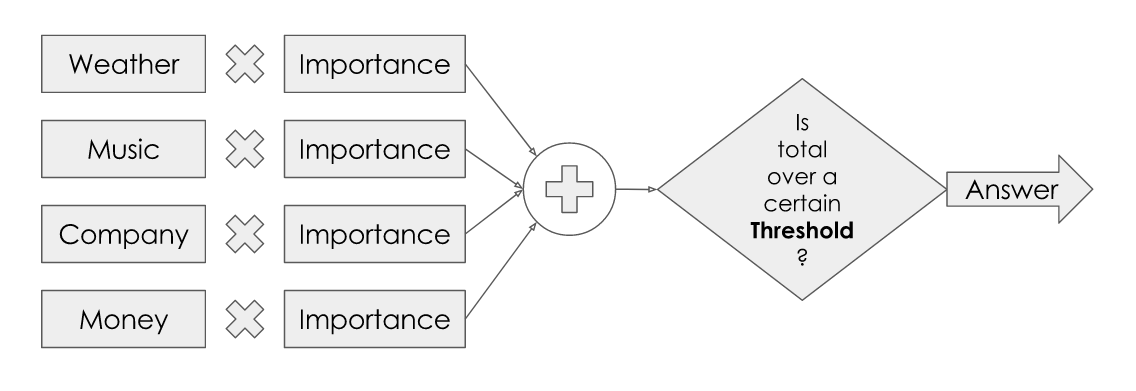
Now let’s look at what happens inside a neuron. Again, we’ll use a trivial example to try and develop an intuition. Imagine I am trying to decide whether to go to a festival. I might consider things like:
- Will the weather be nice?
- What’s the music like?
- Do I have anyone to go with?
- Can I afford it?
- Do I need to write my thesis?
- Will I like the food?
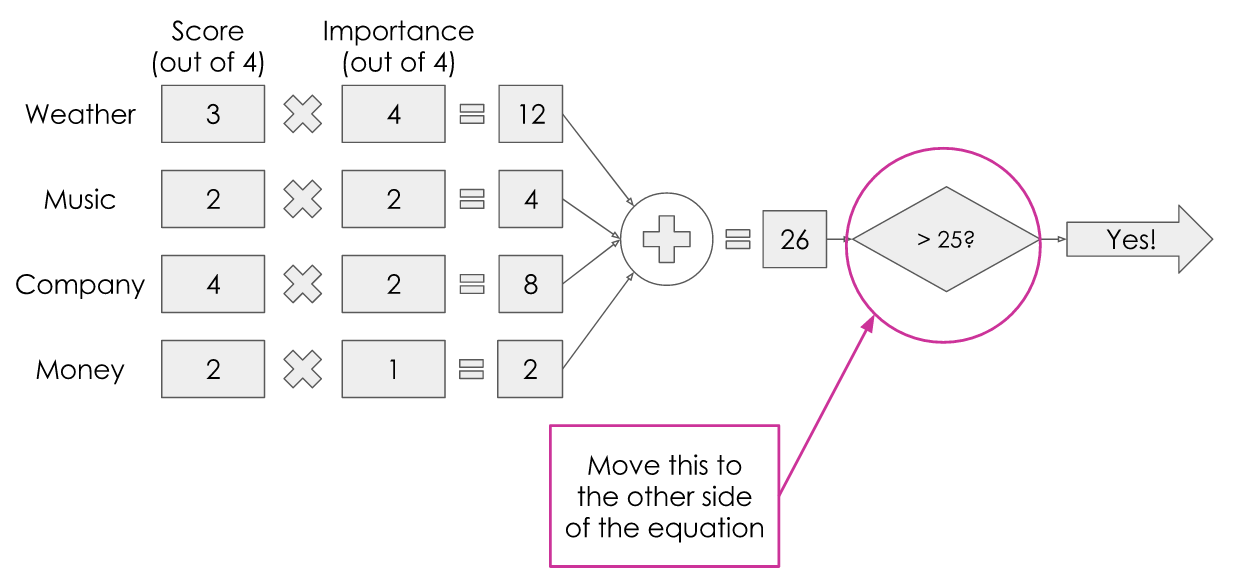
Let’s just take the first four for simplicity. To make my decision, I would consider how important each factor was to me, weigh them all up, and see if the result was over a certain threshold. If so, I will go to the festival! It’s a bit like the process we often use of weighing up pros and cons to make a decision. Let’s try and visualise this:
If I were to try and put some numbers on this, it might look something like this:
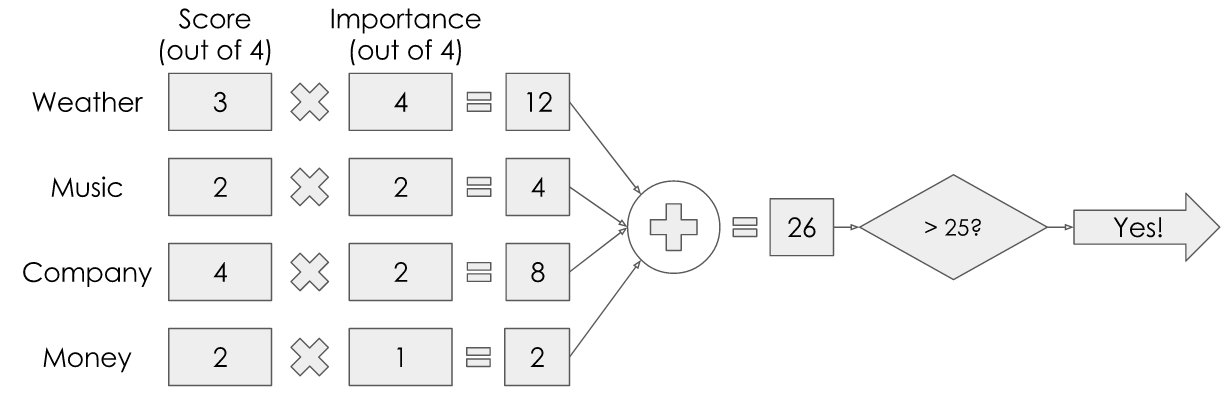
Let’s say the weather is looking pretty good but not perfect, so it gets a 3 out of 4. The music is ok but not my favourite, so it gets a 2 out of 4. Maybe my best friend has said she’ll come with me so I know the company will be great, so it gets full marks out of 4. Money-wise, maybe it’s a little pricey but not completely unreasonable so it gets a 2 out of 4.
Now for the importance: Maybe the weather is very important to me — I really want to go if it’s sunny, and I really don’t want to go if it’s not, so I give it a full 4 out of 4. Music-wise, let’s say I’m happy to dance to most things, so it’s not super important to me and I’ll give it a 2 out of 4. Similarly, I wouldn’t mind too much going to the festival on my own, so company can have a 2 out of 4 for importance. Finally, let’s say I’m feeling particularly flush at the moment so I’m not too worried about money, so I can give it just a 1 out of 4.
I multiply the value of each input by its weight, total this up, then check if it’s over a certain threshold — I’ve arbitrarily chosen 25 in this case. With these values, I get a total of 26, which is greater than 25, so I’m going to the festival!
For those of you who remember GCSE maths, you may recall that we can move operations to the other side of the equation:
Which would give us something like this:
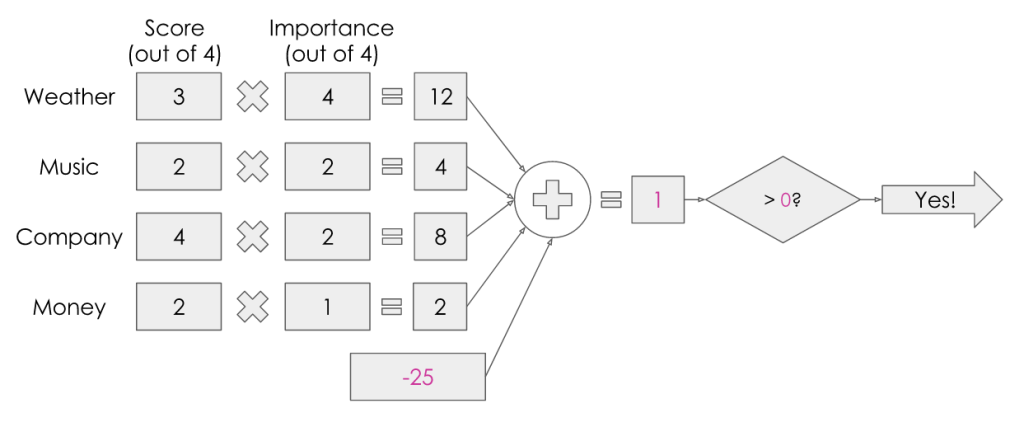
This number is what is known as the ‘bias’ — it took me a while to get my head round where this mysterious ‘bias’ value came from when I started reading about neural nets!
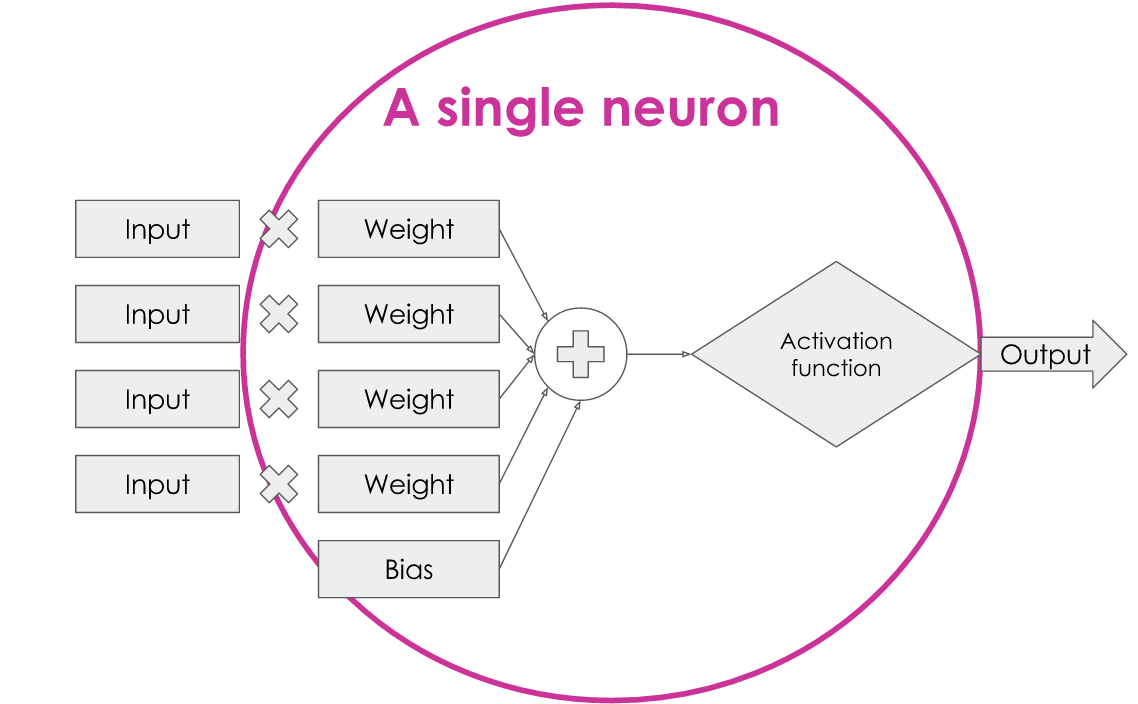
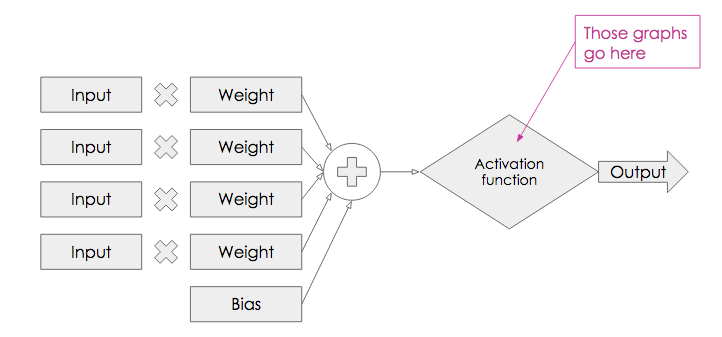
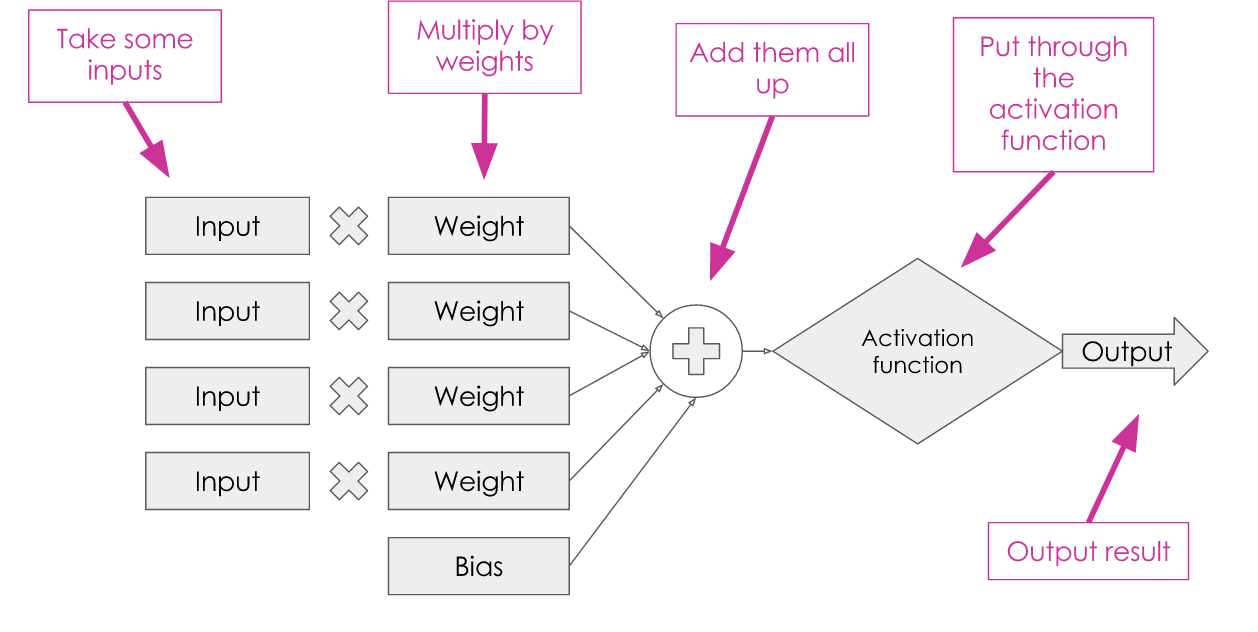
Let’s take a look at this in its general form:
We have inputs that are each multiplied by a weight, summed up with a bias, put through what is known as an ‘activation function’ (in our case, the threshold test) and gives us an output.
Now, we have everything we need for a single neuron!
Constructing a Network
So how do we turn this from a single neuron into a neural network?
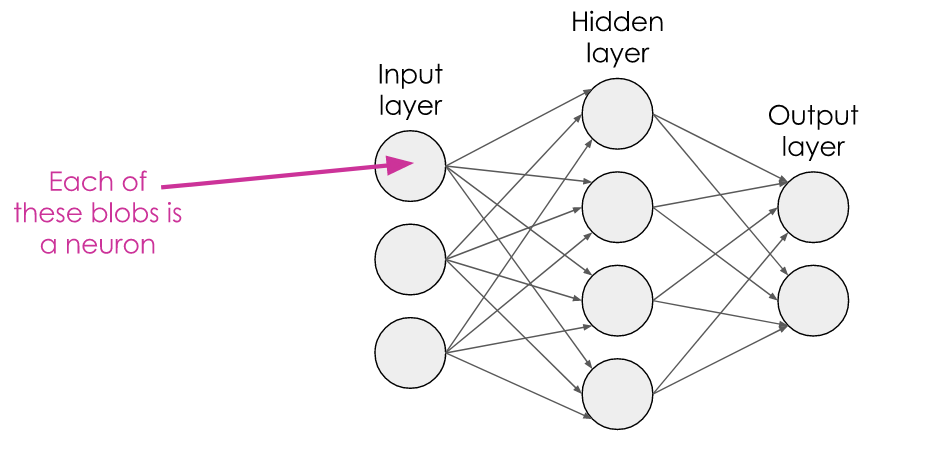
We simply chain up lots of them together! The outputs of the neurons in one layer flow through to become the inputs of the next layer, and so on.
And how do we turn this into a deep network? We simply add another hidden layer:
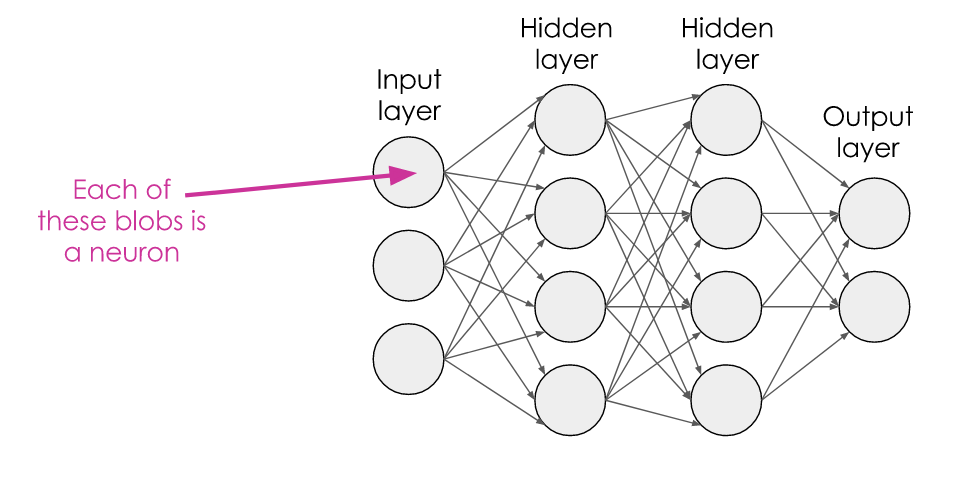
Generally, a neural network can be considered ‘deep’ if it contains more than one hidden layer.
Activation Functions
In our trivial festival example, we only had a binary output; yes or no — which we could achieve with a simple threshold test. But what if you want an output that isn’t binary? For this, we can use an activation function.
Here, we take the result of the sum part of the neuron and find it on the x-axis. We then read up along the y-axis to find the new output value. You can use any function you like, but there are a few that are commonly used:
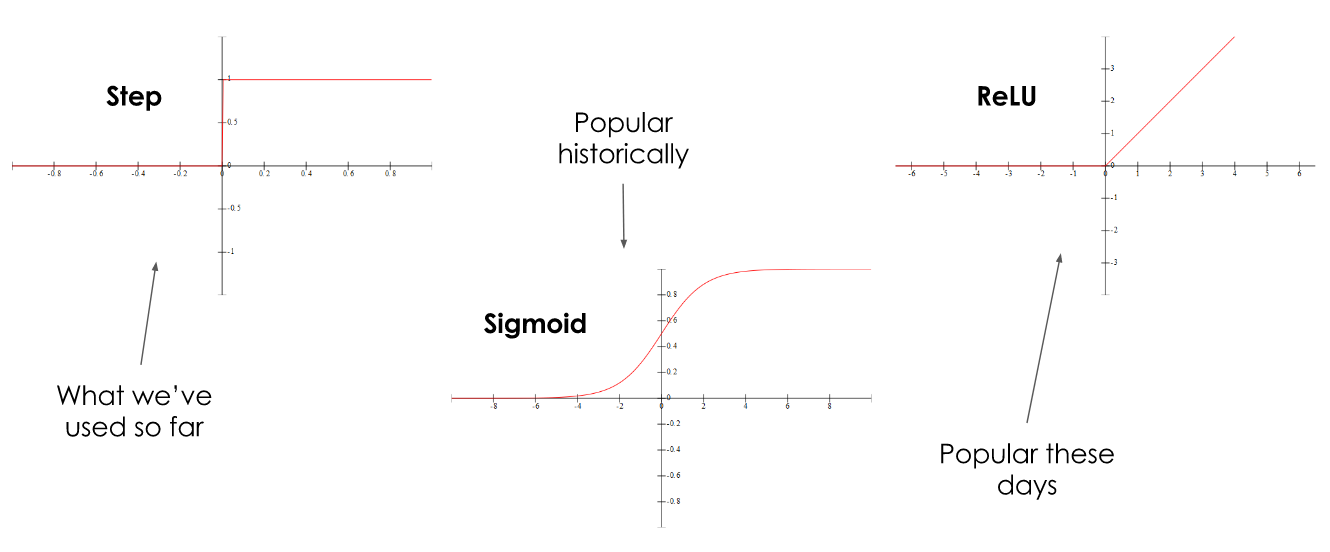
The step function is what we have already seen: Below 0, our output is 0, above 0, our output is 1. The sigmoid function was popular historically as a kind of ‘smoothed out’ version of the step function which can give continuous values. It still gives a 0 at very low values and a 1 at very high values, but continuous values in between. The Rectified Linear Unit (ReLU) function outputs a 0 at values below 0, and outputs the input value at values above 0.
Just to return our model of a neuron, we can see where those graphs fit in:
So, we’ve done some multiplication, some addition, and some pretty straightforward reading off graphs.
Isn’t it all just simple arithmetic then?!
Unfortunately not. In our festival example, we hand-picked the weights and bias to give sensible results. This is easy to do for such a simple case. But for a problem involving many more features and a much larger multi-layered network, this is impossible. The computer itself needs to figure out what the values of the weights and biases should be. That’s the tricky bit! We do this by training the network.
Training the Network — the Short Version
Let’s look at an overview of the steps needed to train the network:
- Randomly initialise the network weights and biases
- Get a ton of labelled training data (e.g. pictures of cats labelled ‘cats’ and pictures of other stuff also correctly labelled)
- For every piece of training data, feed it into the network
- Check whether the network gets it right (given a picture labelled ‘cat’, is the result of the network also ‘cat’ or is it ‘dog’, or something else?)
- If not, how wrong was it? Or, how right was it? (What probability or ‘confidence’ did it assign to its guess?)
- Nudge the weights a little to increase the probability of the network more confidently getting the answer right
- Repeat
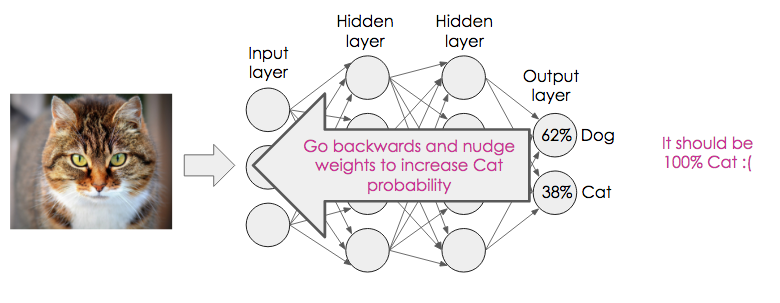
Let’s visualise this. Let’s assume we are training a network to differentiate between cats and dogs. We therefore only need two output neurons — one for each classification. We feed a cat image into the network. For now, imagine that each pixel of the image corresponds to one ‘input’ (we’ll see later how we can improve on this for images). Here, it’s assigned a probability of 62% that the image is a dog, and 38% that it’s a cat. Ideally, we want it to say this image is 100% cat.
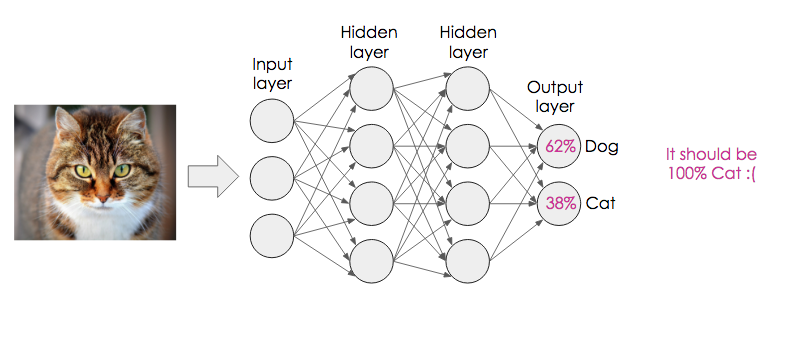
So, we go backwards through the network, nudging the weights and biases to increase the chance that the network would classify this as a cat.
Training the Network — the Long Version
Now let’s take a deeper look at how we do this.
How do we know how wrong the network is? We measure the difference between the network’s output and the correct output using the ‘loss function’.
The loss function is also sometimes called the error function, energy function or cost function. Again, this took me a while to realise, so hopefully that will save you some time!
The best loss function will depend on your data and the intended application. We don’t have time to go into details about the different options, but in the spirit of encouraging intuition, a simple example of a loss function could be ‘mean squared error’ — this is what we learnt at school for fitting a line to data points — you try to minimise the squared distance between each of the points and the line:
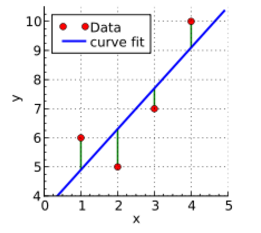
A loss function is doing a similar thing, but in many, many more dimensions. They can get mathematically complicated, but it’s useful just to think of it as the difference between what the network does output and what it should output.
The goal of training is to find the weights and biases that minimise the loss function.
We can plot the loss against the weights. To do this accurately, we would need to be able to visualise tons of dimensions, to account for the many weights and biases in the network. Because I find it difficult to visualise more than three dimensions, let’s pretend we only need to find two weight values. We can then use the third dimension for the loss. Before training the network, the weights and biases are randomly initialised so the loss function is likely to be high as the network will get a lot of things wrong. Our aim is to find the lowest point of the loss function, and then see what weight values that corresponds to. It might look something like this:
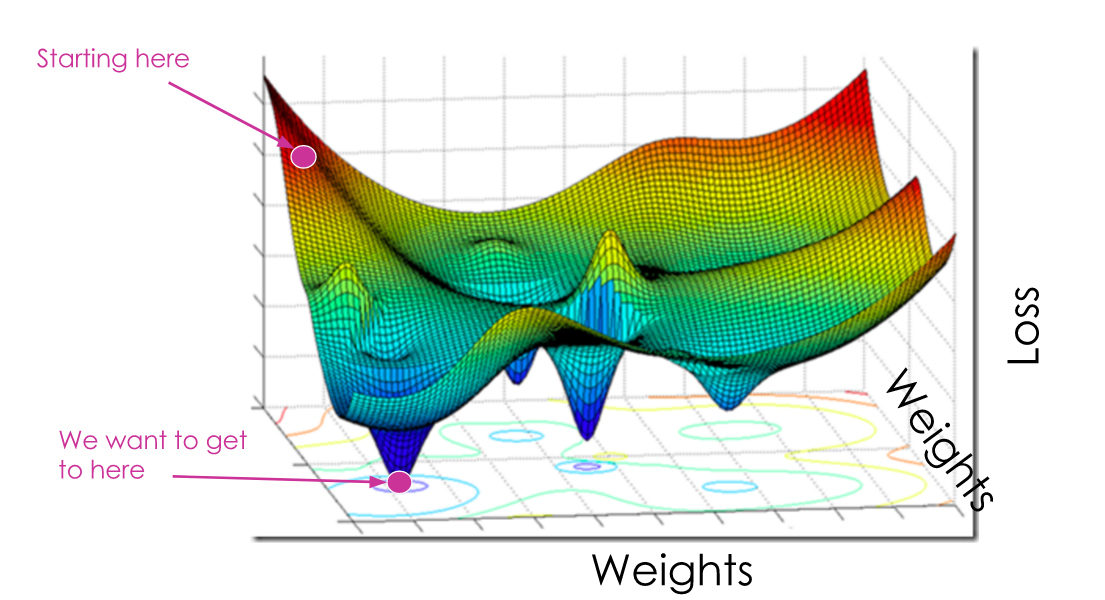 Image source: firsttimeprogrammer.blogspot.co.uk
Here, we can easily see where the lowest point is and could happily read off the corresponding weights values. Unfortunately, it’s not that easy in reality. The network doesn’t have a nice overview of the loss function, it can only know what its current loss is and its current weights and biases are. This is more like how the network sees it:
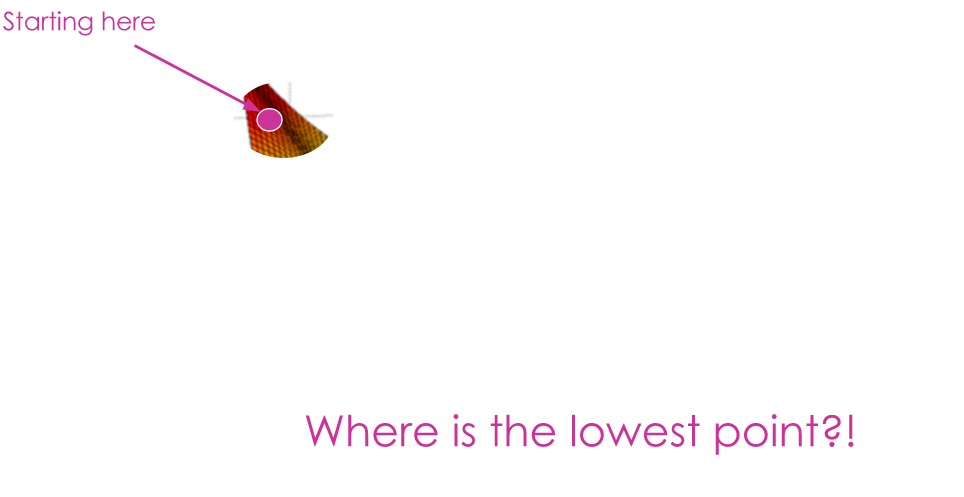
So how do we help the network find the lowest point?!
Gradient Descent
To find the lowest point, we use a technique called Gradient Descent. Imagine you are standing at the top of a mountain but have a blindfold on. You need to make it down to the bottom but you can’t see which way to go. What do you do? You feel around with your foot and find the direction that has the steepest slope, and then take a small step in that direction. You don’t want to take too big a step — that could be dangerous — but you also don’t want to take too small a step — it will take forever to get down.
So in terms of the network’s loss function, we find the direction of the steepest slope downwards, and take a ‘small step’ by nudging the weights a little in that direction.
At first, the loss function will be high and the network will make incorrect predictions. As the weights are adjusted and the loss function decreases, the network will get better at outputting the right answers. Let’s try and visualise this:
As we descend the loss function ‘landscape’, the predictions of the network improve, as does its confidence.
Backpropagation
When reading about neural networks, you’ll often come across the term ‘backpropagation’. This refers to the algorithm used to perform gradient descent across the multiple layers of the network. The name comes from the fact that we start the process at the output layer, and work towards the input layer, propagating the changes backwards throughout the network. We calculate the gradient of the slope at each layer mathematically by taking the partial derivative of the loss with respect to the weights (if that makes no sense to you right now, don’t worry).
The amount we then nudge the weights in that direction is determined by the learning rate — this is the size of our ‘step’ down the mountain.
Don’t Panic!
That was quite a lot of technical detail given that I claimed this post was about creating intuition. But it’s ok, because there are loads of machine learning libraries that take care of the tricky maths. As long as you have a rough understanding of the overall process, you should know enough to read the documentation and start using these libraries. There are loads of options but one of the most popular at the moment is TensorFlow, Google’s open source machine learning library in Python. There are loads of great tutorials to help you get started.
Convolutional Neural Networks
Now let’s look at a special type of neural network called a ‘Convolutional Neural Network’, or ConvNet. Earlier, we visualised a cat image being fed into a neural network, and I said just assume each pixel corresponds to one input.
It turns out, there’s a more effective way to handle image data rather than assuming each pixel is independent.
If you think about an image, normally, pixels have a relationship with their neighbours (unless the image is of random noise). If I pick any random pixel of an image, it is quite likely that at least some of its neighbours are close to it in colour. In other words, there is a kind of structure to the image where neighbouring pixels tend to have some correlation.
ConvNets are specifically designed to take advantage of structure in input data. This is why they work so well for image processing and computer vision tasks.
Images Are Arrays of Numbers
Here, I have pixellated an image of a hand-drawn number to illustrate this. In a monochrome image, each pixel has a value. In the example here, white pixels have a value of 1, black pixels have a value of 0, and grey is somewhere in between. The same principle is true of colour images, but instead each pixel is defined by three numbers corresponding to the red, green and blue channels (sometimes there is a fourth number representing the ‘alpha’ channel which controls transparency). 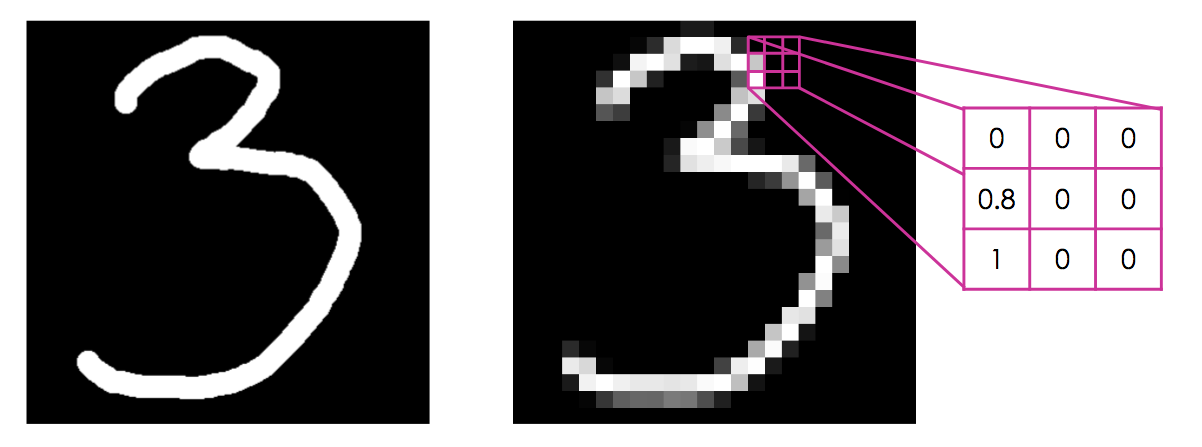
Convolution
Because images are just arrays of numbers, we can do maths on them. A particularly useful mathematical operation we can do is called ‘convolution’. This involves passing another array of numbers over every pixel of the image, multiplying the overlapping numbers, adding them up, and creating a new array containing the results.
The array of numbers we pass over the image is called a ‘kernel filter’. Let’s say we have this kernel filter:
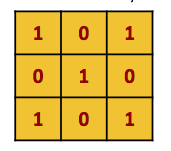
Let’s imagine convolving this with an image represented by the green array of numbers below. The red array represents the result of this convolution operation.
 Image source: ufldl.stanford.edu
Convolving images in this way allows us to perform lots of ‘filter’ effects — many might seem familiar from image editing software like PhotoShop — this is exactly what happens when you apply a filter effect to your photos.
Depending on the values in the kernel filter, different results can be achieved.
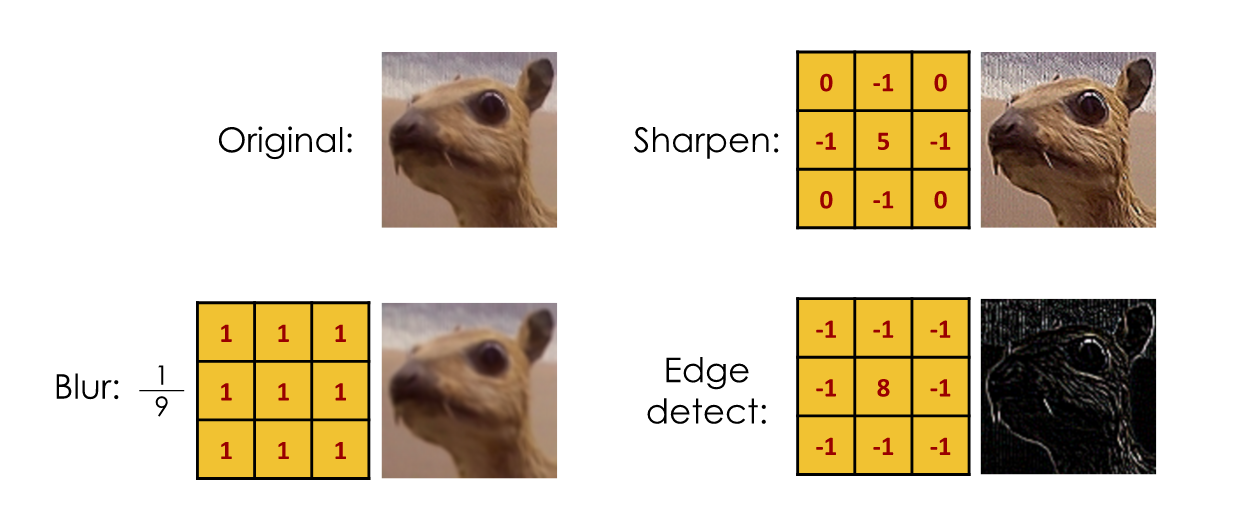
Above, we see how different filters produce different effects. To blur an image, you essentially take an average of a pixel with its neighbours. To sharpen an image or detect edges, you amplify the pixel and de-weight its neighbours.
A Convolutional Neuron
Remember our neuron from earlier? It looked something like this:
A convolutional neuron has got a very similar structure:
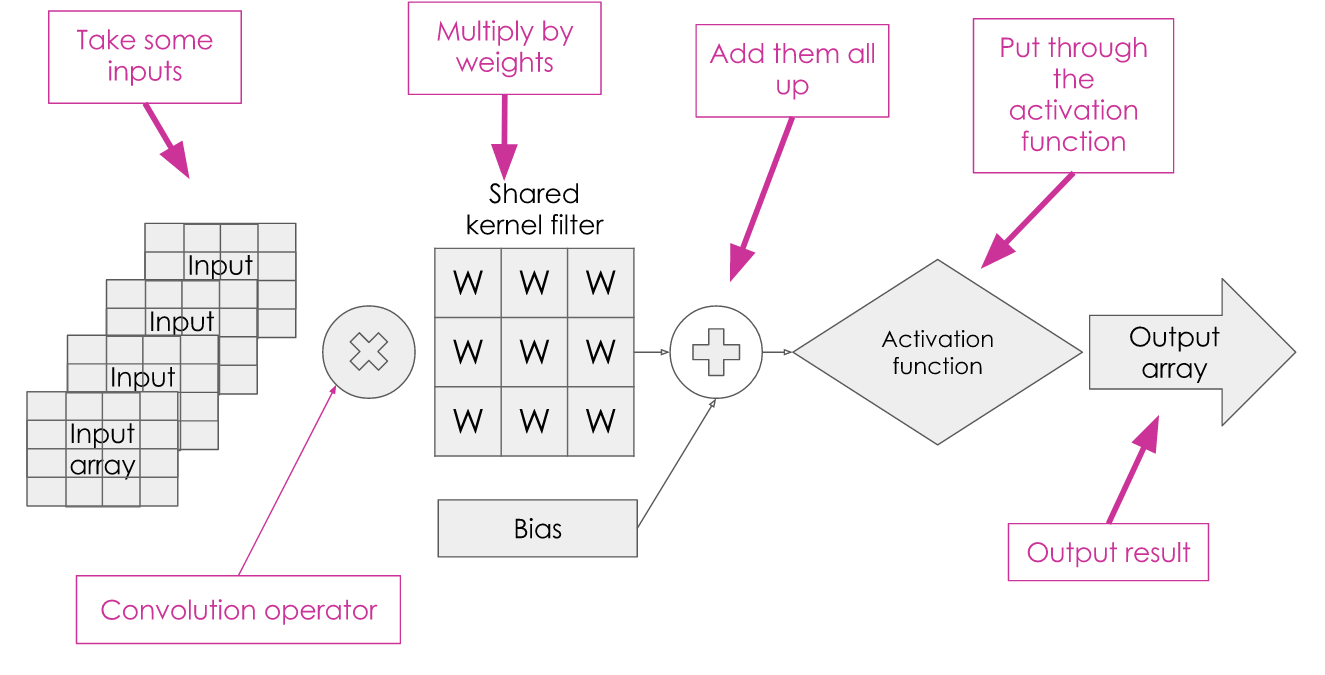
We have inputs; but instead of each being a single value we now take an array of values. Instead of multiplying the inputs by their own weights, we use the convolution operation with a shared kernel filter. The values within the kernel filter are what we need to work out by training the network. We sum the result with the bias and pass it through an activation function to get our output. With a convolutional neuron, the output is often an array rather than a single value.
What’s so Great About ConvNets?
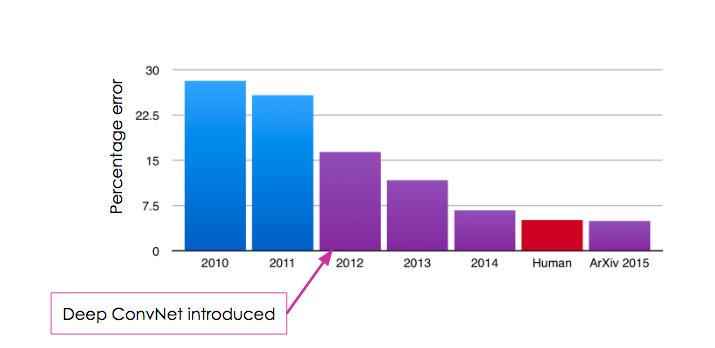
ConvNets have been making a splash in many image processing tasks. One example of this is the ‘ImageNet Challenge’, which asks teams to create algorithms to recognise objects given a labelled training data set.
Results of an algorithm in this challenge might look something like this:
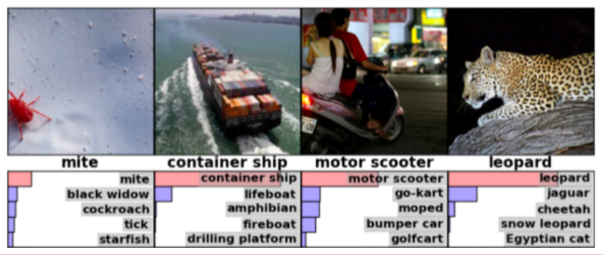 Image source: kaggle.com
As long as the correct object is within the algorithm’s top 5 guesses, it’s considered to have got it right. Until 2011, a good result in this challenge was around 25% error — so the algorithms would still guess incorrectly a quarter of the time, and a single percentage point was considered a good improvement.
When ConvNets were introduced in 2012, the error plummeted to just over 15% — an improvement of almost 10%! This was pretty extraordinary.
Teams continued to tweak ConvNets and in 2015, they actually outperformed humans at the task!
Inside a ConvNet
Remember we talked about how images are just arrays of numbers? And how kernel filters are also just arrays of numbers? This means we can actually visualise kernel filters as images. We can therefore see what weights have been learnt at different layers in the network, which helps us understand exactly how the ConvNet is learning to recognise objects.
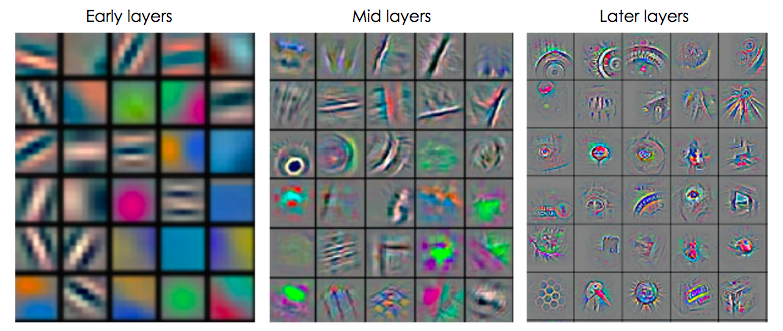 Image source: xlgps.com
Here, we can see that in the early layers, the network is learning very basic patterns: lines, edges and colour patches — the fundamental building blocks of all objects. In the mid layers, the network has began to put these together into more recognisable structures: we can identify corners and curves. Finally, in the later layers, we start to see things that look much more recognisable as parts of objects, such as tyres and boxes.
Apparently, this is not dissimilar to how our own human visual system perceives objects; another example of how neural networks imitate biology.
Fun Applications
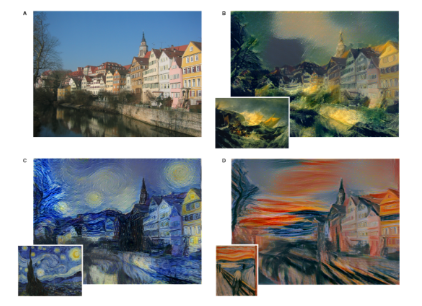
A couple of years ago, Gatys et al noticed a very interesting consequence of ConvNets trained for object recognition. They realised that to identify an object, the network had to learn to abstract away the style of the image. The network should be able to recognise a cat whether it is a photo or a drawing, for example.
They found that the network was essentially siphoning off this stylistic information into certain layers of the network, so that it could be easily ignored. Similarly, certain layers were focused only on the content of the image, which were the layers primarily used for identifying the object.
This meant they could use the ‘style layers’ from one image and merge them with the ‘content layers’ of another image, resulting in an image taking on another image’s stylistic properties. They found they could the transfer the style of classic works of arts onto everyday photos:
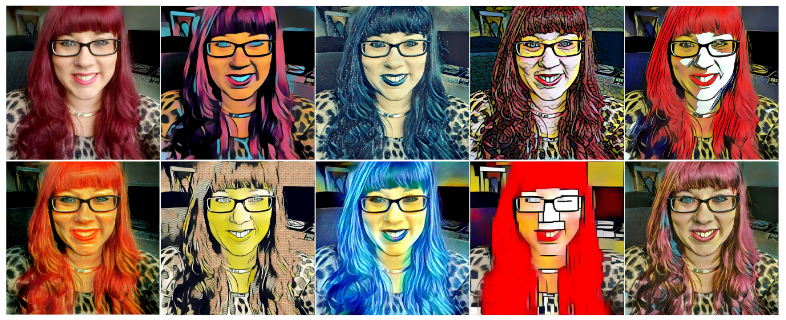
In fact, this algorithm now powers an app called Prisma, which allows you to turn your selfies into masterpieces. I had a lot of fun experimenting with this…
Fooling ConvNets
Another fun (or worrying…) side effect of ConvNets is that they can be easily fooled.
Here, an image of a truck was successfully identified by the network. Then, the researchers applied some distortion to the image that is imperceptible to the human eye — to us, it still looks very much like a truck. But to the ConvNet, this was now clearly an ostrich:
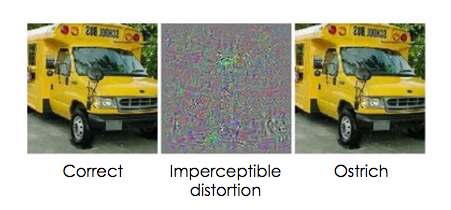 Image source: karpathy.github.io.
Similarly, the ConvNet confidently predicted that this image of random noise was in fact a goldfish:
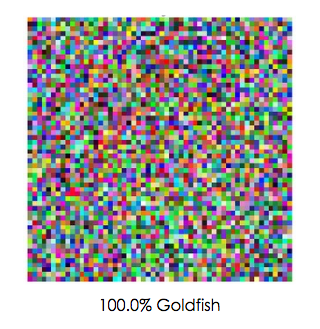 Image source: karpathy.github.io.
Deep Dream
Google brought ConvNets into the limelight with their ‘Deep Dream’ experiments.
Here, they used a trained ConvNet but ran the process ‘in reverse’. Instead of nudging the weights, they nudged the image. This is effectively like telling the network ‘whatever you see in the image, enhance it!’
The results were these mysterious, dream-like hallucinations — earning the name ‘deep dream’ due to the idea that this could be what computers see when they dream.
Here are a few examples…
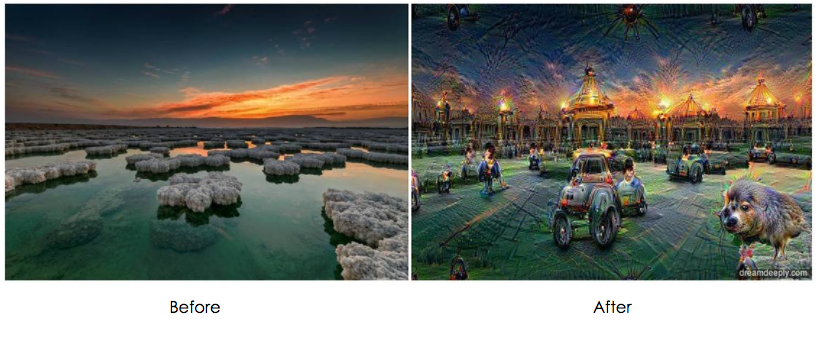 Image source: fromthegrapevine.com
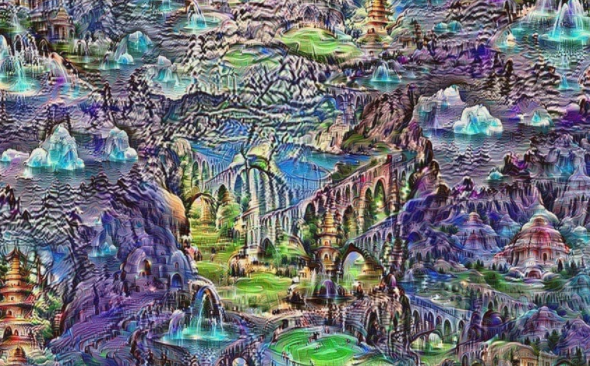 Image source: telegraph.co.uk
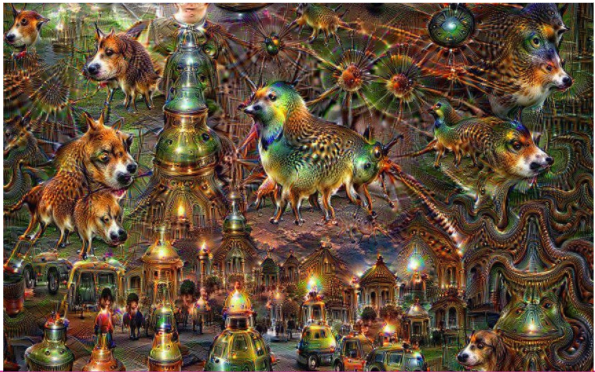 Image source: telegraph.co.uk
The network has dreamt up all kinds of shapes, with plenty of cars, building and dogs. Lots of dogs.
You might be wondering…
Why Are There so Many Dogs?!
The reason is that the ConvNet was trained on a dataset of images which included a lot of cars, buildings and dogs. This means it was predisposed to seeing these objects — kind of like human pareidolia: the bias that causes us to see faces in everything from clouds to toast.
This is actually a really interesting and important point. It can be tempting to assume that computers are objective and infallible, when in fact they are neither. We’ve seen a few examples of this. This is known as ‘algorithmic bias’, and as machine learning is used more and more it’s vital to be aware of this. The network only sees what it’s been trained to see.
This means that humans can accidentally (or sometimes intentionally) transfer their own biases and flaws.
Networks can inadvertently learn proxies and correlations instead of real insight, which can lead to racist, sexist and otherwise irrational results. More and more of these cases are being picked up by the media — this is a great video that discusses some of them.
But there are some things that can help minimise algorithmic bias:
- First of all, take the time to learn about unconscious bias. We all have it, no matter how rational we think we are. If we are more aware of our own cognitive and unconscious biases, we can be more consciously careful not to let them negatively effect our machines.
- Secondly, use output testing to check whether the network has learnt what you want it to learn, and not something that just happens to correlate. You can do this by testing it on carefully designed uncommon edge cases, for example.
- Next, take steps to diversify your training data, ensuring it is genuinely representative and that inconsequential features are distributed evenly across the set.
- Finally, diversify your engineering teams. The more different people from different backgrounds with different perspectives we have building these systems, the better our chance of spotting bias errors and building systems that are broadly applicable.
Phew! We Did It.
We’ve seen what’s in a neuron, how they make a network, what a ConvNet is and some of their interesting applications. But there is a ton we haven’t covered. When reading about neural networks, you might encounter words like: unsupervised learning, pooling, strides, stochastic, batch, dropout, regularisation, transfer learning, recurrent neural networks, generative adversarial networks, and loads more. There is no way we can cover all this in one post! However, you should have a good foundation to go on and read about these things even more.
Also, Andrej Karpathy, one of the biggest names in ConvNets right now, tweeted this:
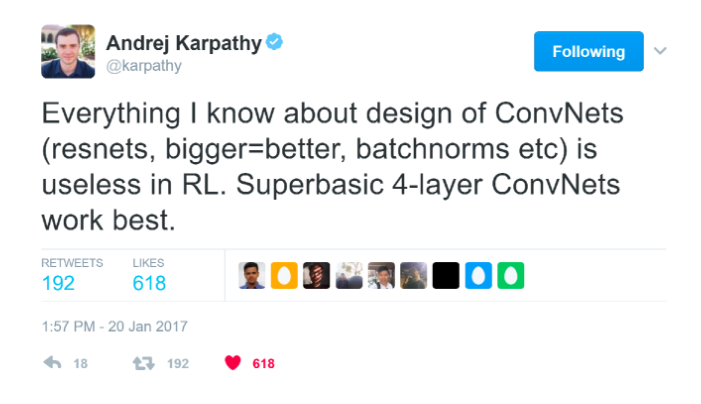
So in the words of an expert, a basic 4-layer ConvNet works best in real life.
And if you remember from earlier, we know about convolutional neurons, and we know about 4-layer networks, and we know we can use a library like TensorFlow to build them:
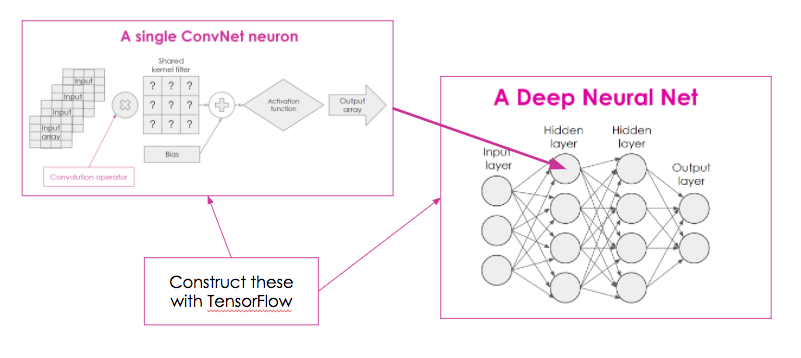
So you should have all you need to start building some useful stuff! Yay. Thanks for reading! Let me know if this has helped by leaving a comment or tweeting me @RosieCampbell
Resources
AI
June 19, 2016
The Eu Referendum: On Evidence, Game Theory And ‘Self-Interest’
An Idealogical Case for #VoteRemain, When an Evidence-Based Decision Seems Infeasible
Like David Mitchell, I am annoyed that I have been given the responsibility of having an informed opinion on the EU. I know little of economics, foreign policy, international diplomacy, global affairs or any of the other elements that should be considered. As much as I try and educate myself, I am never going to have the experience, expertise and time to make an informed decision on such a complex issue.
Surely the point of politicians is that we elect representatives to make these decisions for us — it’s their job to be well informed. The rest of us, with the best intentions, have jobs and other commitments that mean we can’t devote the necessary energy to it. A referendum on anything more consequential than something like ‘what should our flag look like?’ seems irresponsible to me.
But here we are. I could abstain, but if every moderate individual abstains the playing field becomes wide open for extremists, which I definitely don’t want.
On Making An ‘Evidence-Based’ Decision
As a self-proclaimed skeptic, I strive for evidence-based decisions. However, I’m finding it nearly impossible in this case for a number of reasons:
- Fear-mongering: Every day, there seems to be a new terrifying claim about an awful thing that will happen if we leave/remain. It happens with such frequency I have become desensitised and cynical.
- Misinformation: The controversial ‘£350m a week’ figure shows how stats that are technically true can be misleading without appropriate context. This kind of misinformation makes it incredibly difficult to sensibly interpret the stark numbers we are presented with in the media. On top of this, there obfuscation around what the EU actually covers (in terms of sovereignty, human rights etc).
- It is unprecedented: Even assuming none of the misinformation is wilful, none of us really know what effect leaving the EU would have as no country has done it before. I don’t trust any of the the confident claims about deals that would be made or reforms that would happen in either outcome.
For these reasons, I don’t know how to make an evidence-based decision. Despite every critical and scientific bone in my body, I have to reluctantly admit my decision is largely based on ideological reasons. It’s the best I can do; perhaps even the best any of us can do, if we’re completely honest with ourselves.
Before we go on, I’d like to stress that from the research I’ve done, I do believe that ‘remain’ will probably be better for Britain in both the short and long term. But I can’t be sure. So now let’s examine why even if I didn’t believe this, I would still ideologically align with ‘remain’.
Cooperative Behaviour
When you team up with others, it’s because you believe it will be mutually beneficial and for the best overall. That’s not the same as expecting it to be brilliant for you at all times. There will be times of hardship, and you might be called on for help. Then at some point, the favour will be returned. Making a commitment means sticking it out when times get tough, in the knowledge that it will be for the best in the long term.
There is no point joining a partnership if you plan to jump ship at the first perception that things are not currently 100% in your favour.
This is basic game theory. In a repeated game (like living in the world), the best strategy is cooperation. Even if it looks like defecting will give you an immediate advantage, this is short lived and outweighed by the long term advantages of having an alliance.
Compassion Over Self-Interest
To me, one of the saddest things about this whole episode is how the people of Britain have been treated like spoilt children who make decisions entirely out of self-interest: all the arguments are based on whether it will be better for Britain to leave/remain.
Frankly, I find it insulting. In general elections, I don’t vote for what I think will most benefit me individually, but for what I think will most benefit society overall, and the same will be true of my vote in the referendum. Even if I did believe that Britain would be worse off in the short term (which I don’t) I would still want to make my decision based on compassion and empathy for those less fortunate than me, including people who aren’t British.
If campaigners want to get my vote, they should stop telling me what they think I want to hear about the benefits for me as a Brit, and start telling me what I actually want to hear about how leaving/remaining can help make the world a better place. Britain has problems, but overall we have it pretty good here, and I want to be part of a country that uses its position to lift others up, not one that isolates itself out of fear and selfishness, and I suspect we can do that better if we remain.
In a terrifyingly short time, we’ve gone from the absurdity of flotilla wars on the Thames to the horrific terrorist assassination of an MP who defended immigration. We need to step up to the plate and unite against hate and fear. As my friend and colleague James put it:
“We shouldn’t be putting British interests first. We shouldn’t be asking ‘What can we get out of this?’. We should be asking ‘What can we do to help?’”
Couldn’t agree more.
November 9, 2013
Surviving in a Hungry Tribe With Game Theory!
If you’re interested in science/maths/that sort of thing, and you don’t already know about brilliant.org, this needs to be fixed!
It aims to nurture thinkers all over the world by gamifying maths and physics problems.
I love puzzles, and I actually really miss solving these kind of bite-sized problems that seemed incessant at school but don’t seem to feature so much in the real world. Brilliant.org fills a puzzle-shaped hole in my heart that’s been empty since I got bored of soduku.
I recently completed an online Game Theory course (which I highly recommend) in another online education favourite of mine, Coursera. So when I found out brilliant.org were running a game-theory-algorithm-writing programming competition, I got a little excited.
Each entrant had to write a python script that makes decisions on how to interact with every other entrant, based on a given scenario and some key data. Brilliant.org then played everyone’s algorithms against each other to see who would survive!
The details of the scenario and game rules can be found here, but here’s a summary.
The Scenario
You’re a member of a tribe. Everyone begins with a certain amount of food. Each round, you go through every other member of the tribe and choose to either hunt or slack with them (I shall call this an ‘interaction’). How much food you receive from each interaction depends on both what you decide to do and what your interaction partner decides to do. You each decide independently — you don’t discuss it with your partner.
The Payoffs
Hunting and slacking use up different amounts of food units, and also return different amounts. Read the rules for full details, but here’s the outcome of what you win/lose depending on what you and your partner do:
Both slack: Both lose 2 food units
Both hunt: Neither gain nor lose
One slacks, one hunt: Slacker wins 1 food unit, hunter loses 3 food units
The amount of food you receive from the round is the sum of your winnings from each interaction. If your total food falls to 0 or below at the end of a round, you starve and die and are no longer in the game.
Public Good
To complicate matters, there is the chance for everyone to benefit from a ‘public good’ incentive. A random threshold is chosen, called ‘m‘, and if the sum of the number of times players choose to hunt reaches this threshold, EVERYONE (even slackers) get a food bonus.
How the Game Ends
Each round, there is a small random probability the game will end. The game would also end after all but one player has starved, if that happens sooner.
Reputations
Everyone in the tribe has a reputation, which indicates how likely they are to hunt (based on their past decisions) between 0 and 1.
Each round, your script is provided with a list of the reputations of everyone left in the tribe. The order of this list changes each round, so you can’t simply track what a player did last time. You’re also provided with the value ofm, and some key data like how much food you have etc. Based on this information, your script must return a list of ‘hunt’ or ‘slack’ decisions for each player.
So How Do You Decide What to Do?
Let’s look at the beloved game theory ‘payoff table’ for this game:
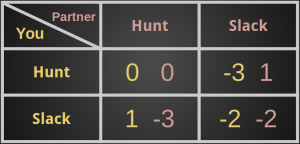
You may spot that regardless of what your partner does, you are better off slacking. If they hunt, you can take advantage of this and gain a unit by slacking. If they slack, losing 2 units is better than losing 3, so again you are better off slacking. This makes slacking the best response in all cases and therefore a dominant strategy.
Unfortunately for you, your partner can probably recognise this as well, so you’ll both end up slacking — resulting in a Nash equilibrium. Annoyingly, this means you’ll both be worse off than if you both hunted!
You may recognise this as the famous ‘prisoner’s dilemma’. Indeed our tribal scenario is simply a variation on this classic.
So how do we encourage people to put aside rational self-interest for the good of all? This is pretty much what society is built on — people adhere to rules that may inconvenience them personally, but overall this makes a better society from which everyone benefits.
This works because we don’t expect the world to end any time soon, so we all want to make it a nice place to live. Repeated games encourage cooperation, because we know we will reap the benefits of everyone working together. They also allow players to build up a reputation, so we know who to trust.
In our tribal game, we know there is only a tiny chance of the game ending each round, so we should view it as a repeated game. It is therefore worth abandoning the dominant strategy (to an extent) and developing a more cooperative strategy, so that we might reap the wards of mass cooperation.
My Algorithm
With this in mind, I worked off a few basic premises:
- No point hunting with those who have a very low reputation, as they will likely slack and you will be left out of pocket!
- No point hunting with those who have a very high reputation, as they are so likely to hunt that it is worth taking advantage of them.
- Need to introduce some randomness into my choices to throw those trying to track players off the scent.
- Need to generally reward players who hunt and punish those who slack
- Need to maintain a relatively good (but not too good!) reputation.
- More likely to hunt when ’m’ is low, as there is more chance of achieving it and gaining the public good reward.
Extreme Cutoffs
To address 1 and 2, I decided immediately that I would never hunt with those with reputations of less than 0.2 and more than 0.9.
Keep ’Em Guessing
To address 3, I decided to base my decisions on a probability distribution. A Gaussian would give me a low chance of hunting with players who have extreme reputations, and the highest chance of hunting with players who have reputations of around 0.5. The image below shows a Gaussian bell curve shifted to be between 0 and 1 and centre on 0.5 (and the equation that generated it).
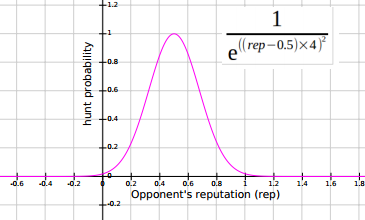
It is possible that some players would be using machine learning techniques to try and identify particular players and their strategies — introducing an element of randomness was an attempt to fly under the radar.
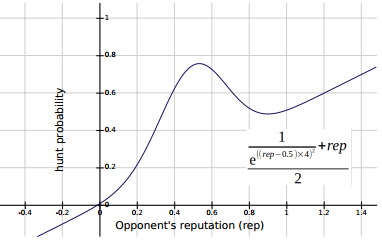
Reward the Hunters
To address 4, I weighted the Gaussian using the players reputation, so that the probabilities were skewed in favour of those with a higher reputation. The image below shows the new weighted Gaussian and the equation that generates it.
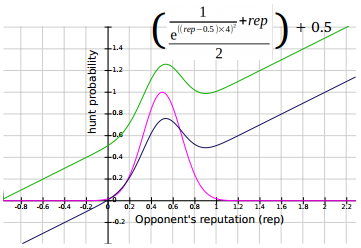
Keeping up Appearances
To address 5, I kept tabs on my own reputation and if it fell below 0.5, I aggressively ramped up my probabilities by a factor inversely proportional to my falling reputation. This ensured my reputation would never fall too low (and risk me getting starved out by others punishing slackers). So the probability function varies between the blue line and the green line in the image below depending on my reputation — only reaching the green line (and therefore maximal hunting chances) if my reputation falls right down to 0.
‘Big Society’
To address 6, each round I keep track of the proportion of hunts that have taken place throughout the game relative to the total number of interactions. If m is less than the average number of hunts per interactions, we have a good chance of reaching it and I decide it’s worth going for! I then increase my hunt probability by a small factor.
Results!!!
440 teams entered, 45 survived, and ranked according to their final food amounts, I came 9th! Very pleased with this, especially as I hadn’t had time to make the algorithm as advanced as I wanted (would have liked to add in some machine learning!)
We were provided with some stats about the game, and it was interesting to see that most people who survived finished with reputations between 0.5 and 0.6:
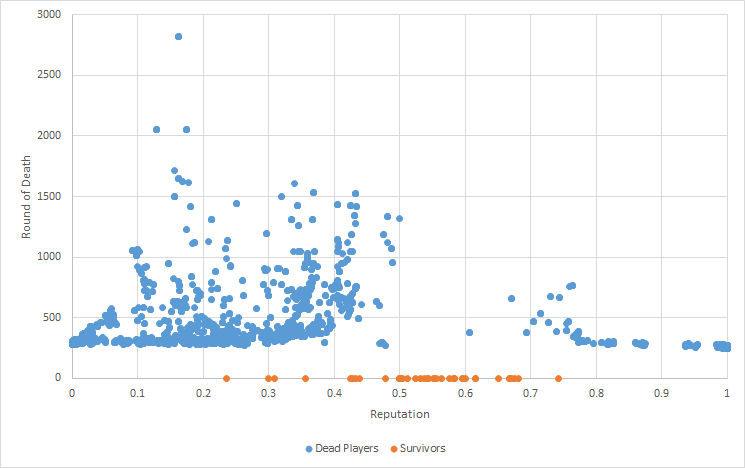
This seemed to be the sweet spot of maximising slacking but still maintaining a reputation good enough that people aren’t put off hunting with you. Luckily that’s pretty much what my algorithm did, by maintaining a reputation of just over 0.5.
Sadly I missed out on the top 5 who each won £1000… but I do win a t-shirt saying ‘I survived’!
Find Out More
The full tribal rules can be found here: https://brilliant.org/competitions/hunger-games/rules/
Also check out some of the winners: https://brilliant.org/competitions/hunger-games/results/
